
Find and follow logs
Understand retained history, live logs and collection gaps.
LogForge · Runs in your infrastructure
Before you begin
- Where: LogForge in your browser; no host shell needed.
- Access: permission for the environment. Live viewing also needs Operate access and a connected agent.
- Open: Overview > Hosts, expand the host, select a workload, then Logs.
Saved history stays available after you leave the page. Live output shows what is arriving now.
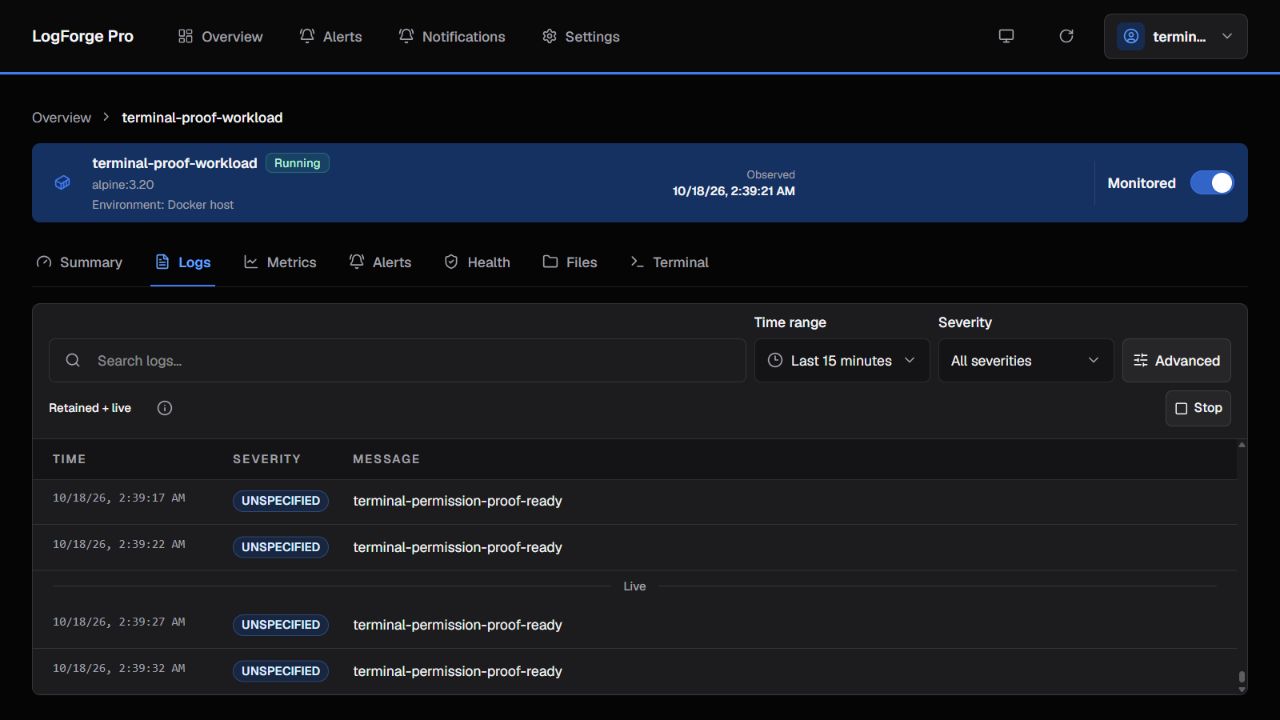
Example workload. Saved rows appear above the Live divider.
Read saved history
- Choose a Time range covering the event.
- Use Search logs and Severity to narrow the rows.
- Open Advanced for a LogsQL filter, an expression that narrows stored queries.
- Clear filters when checking whether any data exists.
Check: the rows belong to the selected workload and time range. An empty result alone does not mean the agent is disconnected.
Retention: turn on Monitor logs and alerts to save new logs. Turning it off stops new retained logs and alert evaluation; previously saved evidence stays available.
Watch live output
- Choose the log source if the LogForge server offers more than one.
- Choose Start live logs if streaming has not already started.
- Watch new rows below the live boundary.
- Choose Stop when finished.
Check: new output arrives, then streaming stops. Buffered live rows can remain visible after Stop.
- Monitored workload: the view can combine saved and live rows.
- Live only · Not retained: new rows are not saved. Docker may supply a limited recent backlog.
- View-only access: saved history may be available while live viewing is denied.
Leaving the page, signing out, or losing the connection ends the stream. Restore connectivity and start a fresh session; missed live output is not automatically replayed.
If logs are missing
Check application output, monitoring, filters, and time range. Docker collects standard output/error; a file inside the application is not automatically collected.
Follow No data, or continue with Metrics to check the second signal.