Inside LogForge
Logs, metrics and access.
In the same workload.
Start with the workload you’re investigating. Read its logs, check resource use and open a permitted terminal session without switching tools.
01 / Logs
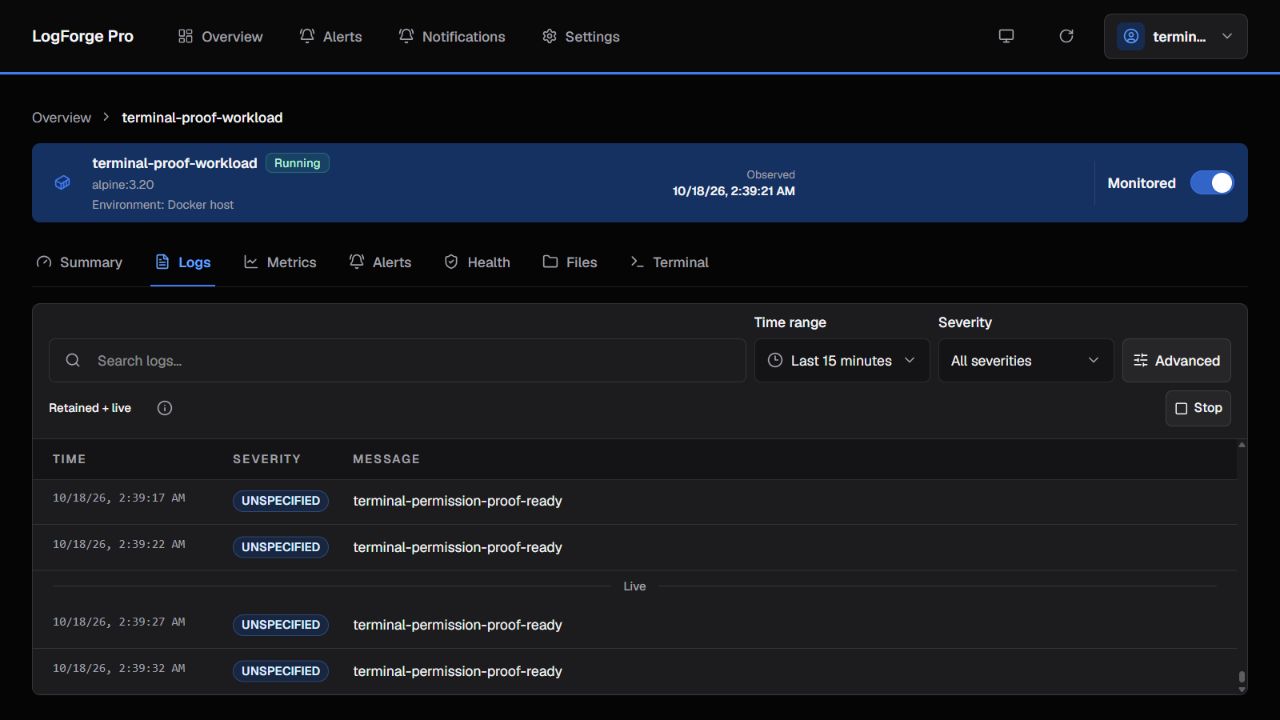
Find the messages that matter.
Search by text, narrow the time window and filter severity. Read retained history and follow live output in the same view.
02 / Metrics
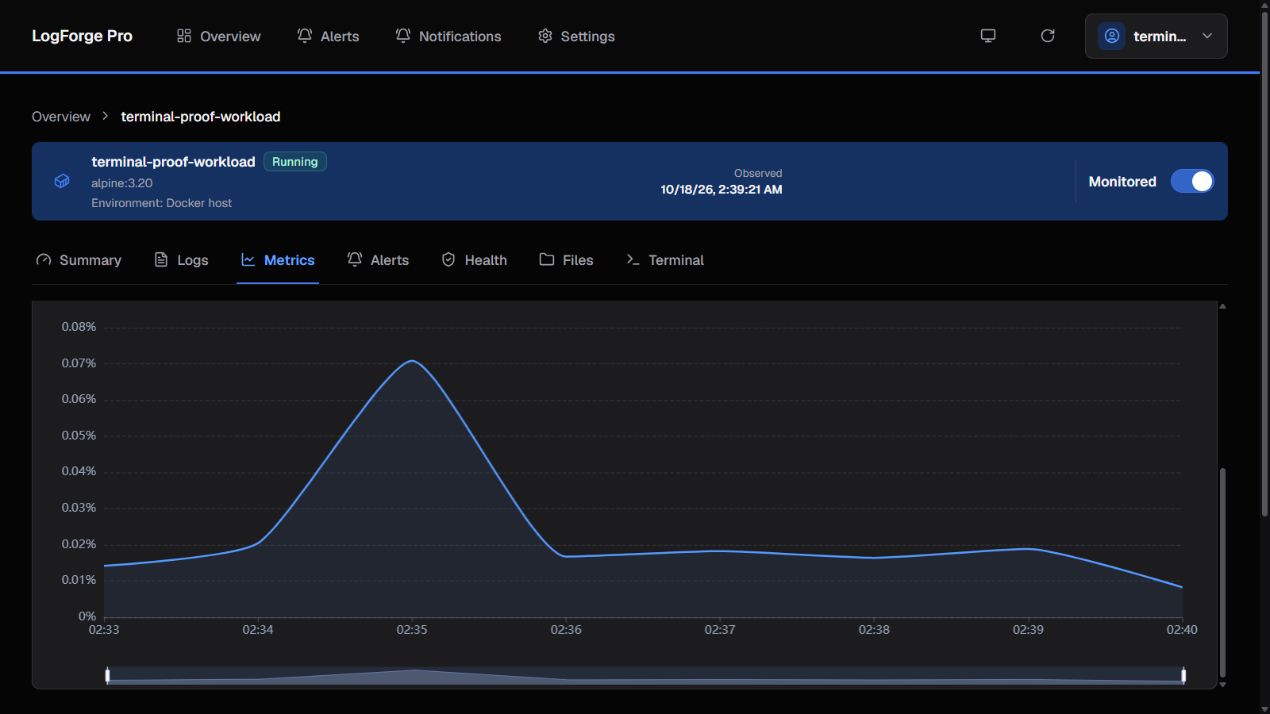
See how resource use changed.
Choose a metric and time window. Compare the latest value with the average, minimum and maximum, then inspect the chart.
03 / Terminal
Investigate in place.
Start a terminal session when your permissions allow it. Stay with the workload while Central controls access to the operation.
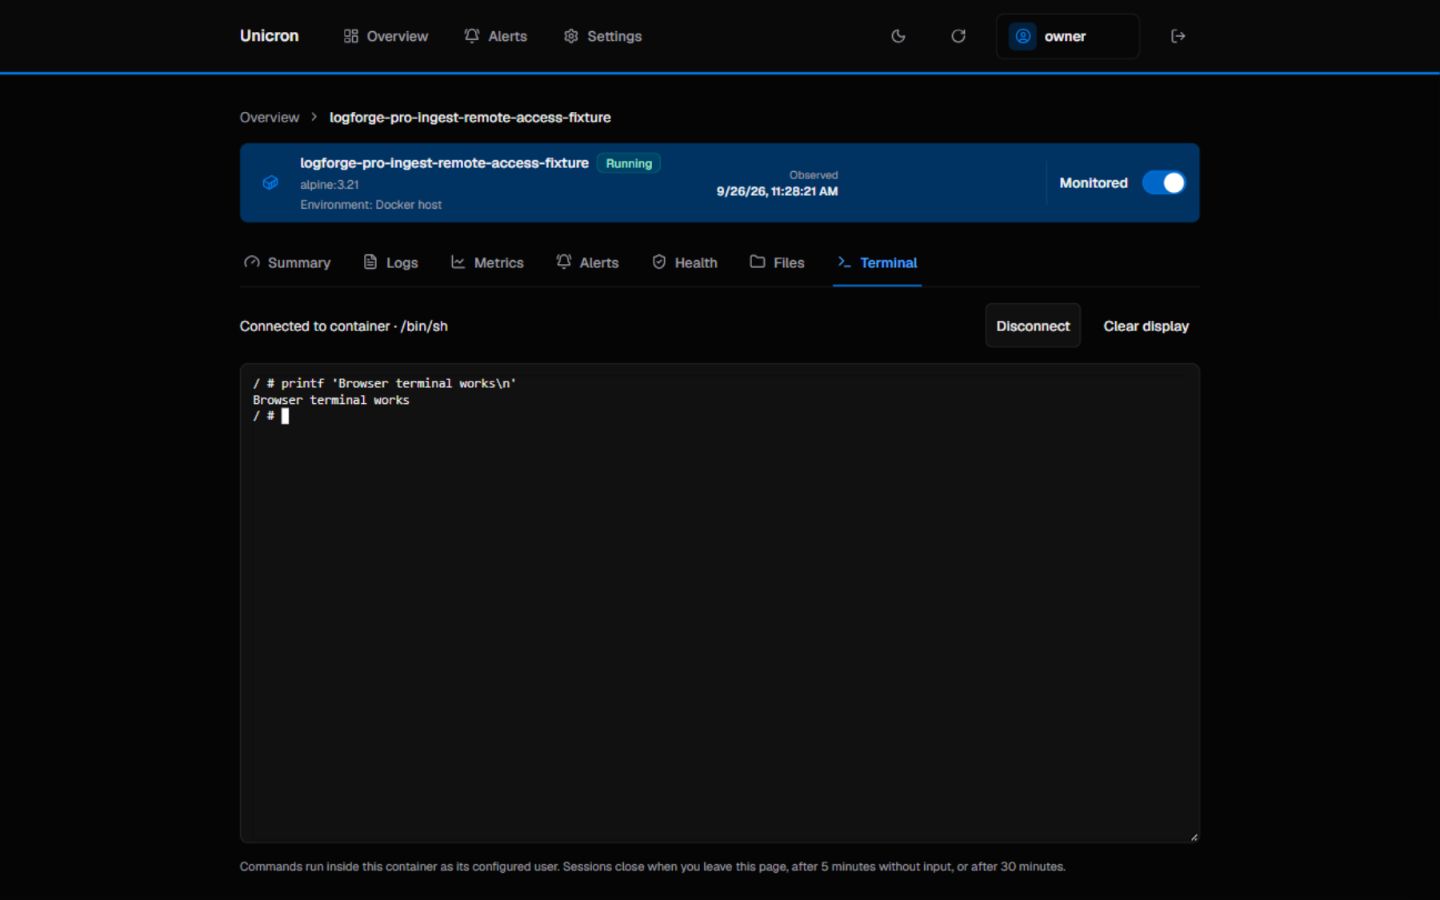
Real development screens. These images show the local application; this website does not connect to the pictured workloads or run these tools.
Run LogForge in your environment.
Read the setup overview or choose capacity for your team.