Monitor your first workload
Follow one Docker workload from discovery to logs and metrics.
LogForge · Runs in your infrastructure
Before you begin
- Ready: LogForge installed online or air-gapped, a connected Docker agent, and a running container.
- Access: sign in to LogForge as the local Owner.
- Commands: Bash on the agent's Docker host, from any directory.
Choose an application you may observe. It must write to standard output or standard error, which Docker collects. Files written only inside the application are not automatically Docker logs.
Start a sample container
Use this sample if you plan to follow Your first alert. For an existing application, skip this command and use its own log messages instead.
Run on the agent's Docker host. This uses BusyBox 1.37.0, selects the json-file log driver, and publishes no ports. On an air-gapped host, have your administrator supply that exact image through the approved transfer process first; the sample is optional.
docker run -d --name logforge-docs-first-workload --log-driver json-file busybox:1.37.0 sh -c 'while true; do echo "logforge first workload ready"; sleep 5; done'
Check: Docker prints an identifier. The sample writes logforge first workload ready every five seconds. If the name is taken, inspect the existing container before retrying.
Find and monitor the container
- Open Overview > Hosts, expand the intended host, and select your container.
- Check Health. Resolve disconnected agents or stale inventory.
- Turn on Monitor logs and alerts. Compact views may say Monitoring or Monitored.
- Wait for the change to finish applying.
Check: monitoring is on, with no pending or failed collection state.
Check saved logs and metrics
- Open Logs, select a current Time range, and clear search and advanced filters.
- Produce an application log or wait for the sample's next message.
- Find the message in saved history, above the Live divider.
- Revisit the view and find the saved message again. Choose Stop if live streaming starts.
- Open Metrics, choose an available Metric, and check its latest sample time and chart. Rates need multiple samples.
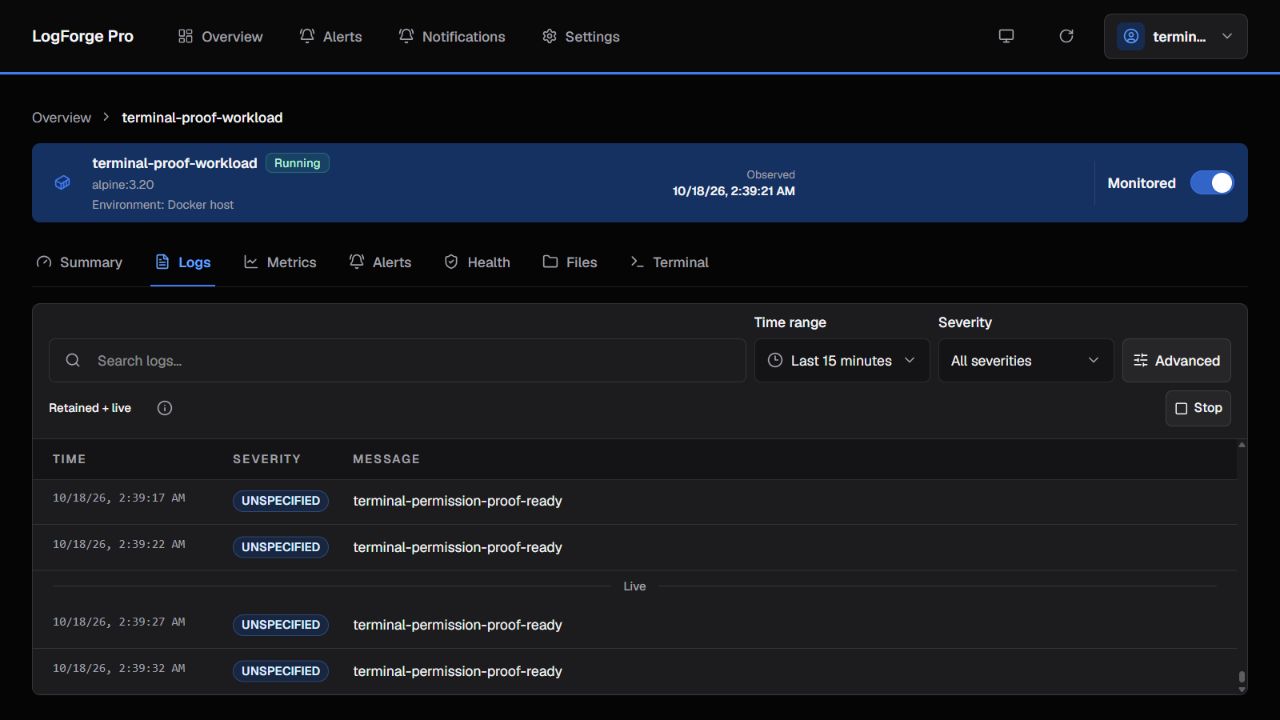
Example workload. The monitoring switch is at the top right. Saved rows are above Live. In this exercise, look for logforge-docs-first-workload and its logforge first workload ready messages.
Important: Live and Recent local rows do not prove retention. Stop ends the stream but can leave buffered rows visible. Unmonitored live rows are not saved.
Check: you can query both a saved log and a recent runtime metric. Metrics are automatic and independent of log monitoring. See Logs, Metrics, or No data.
The sample is almost idle, so a flat CPU chart can be normal. Check that its sample timestamps are recent.
Repeat the readiness check from your online or air-gapped guide. To try alerting, keep the sample running and follow Notifications, then Your first alert.
Remove only your sample
Run these only if you created the sample above and have finished any alert exercise:
docker stop logforge-docs-first-workload
docker rm logforge-docs-first-workload
Check: your sample is removed. Keep existing applications and agent state.